

Greater than 7 minutes, my friend!
Google Analytics for Freelancers: Mastering your Data Part 1. Creating dashboards to know what happens
Suppose you are doing all the things you’re supposed to do for improving your SEO and online image: writing great content, maintaining your site, being active on social media, and so on. But it takes another level to measure and analyse your results.
Have you installed Google Analytics?
When was the last time you looked at it?
Do you feel overwhelmed because you are not sure what to look at?
Two main services I tried to use for my website and blog were Google Analytics and Google Search Console. But they offered me so MUCH data that I preferred to ignore them completely.
Things had to change. So I’ve passed the Google Analytics exam and now I am going to dive into analytics weekly and monthly as one of my steps to getting more valuable leads.
If you are interested in managing your website’s data, follow me with 5 not very simple steps to find everything you need each time you log into Google Analytics without navigating through numerous reports.
We’ll learn how to create customized dashboards for bloggers and freelancers to find meaningful data more easily. In the next posts, I’ll analyse ways to use each of these dashboards.
If you are new to Google Analytics, follow the instructions here to create a Google Analytics account. After registration, you are provided with some code to install on your website. If everything is correct, you get your first statistics within 24 hours.
Note: If you are unfamiliar with Google services and relevant terminology, you could start with some basic courses like Digital Garage by Google.
STEP 1: YOUR DEFAULT TRAFFIC STATISTICS
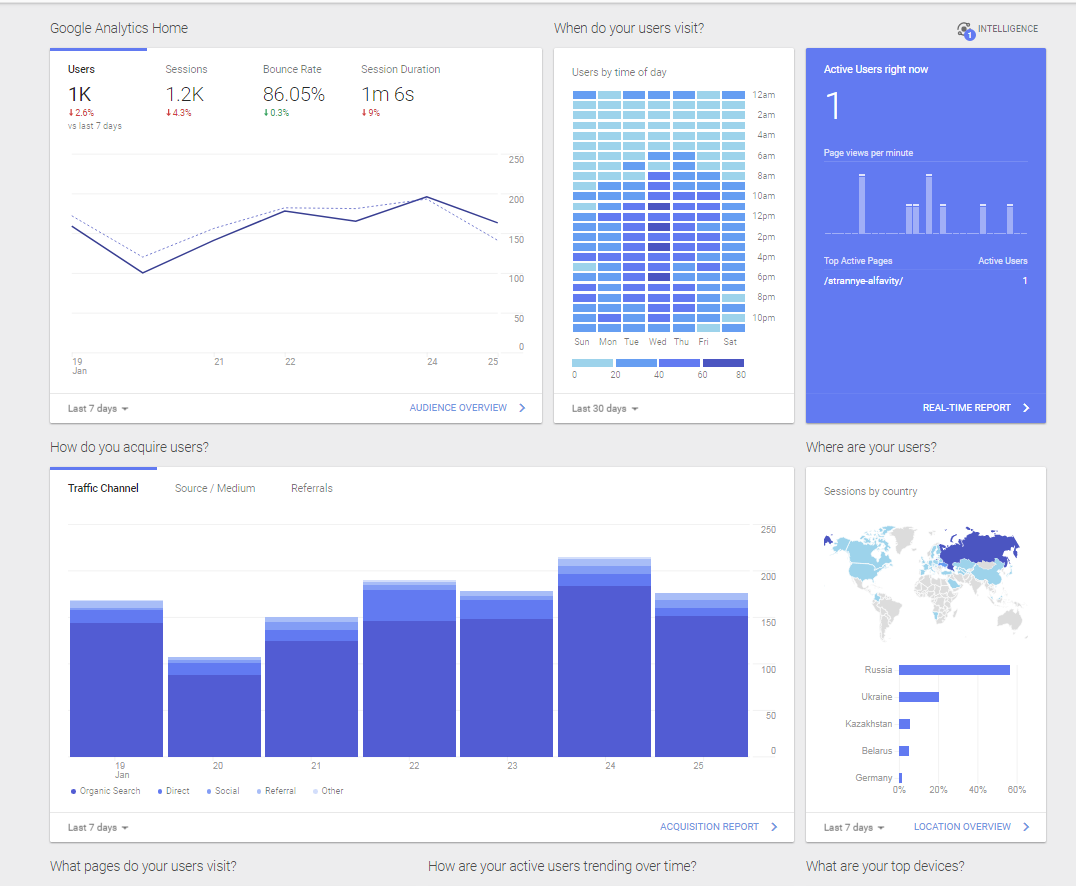
If you want to take a quick look at how things are going, the default report (the page you see when you log in) is the only page you need.
Basic things to learn from the report:
- Pageviews: how many times your web pages have been viewed
- Users: number of unique people who visited your website
- Sessions and session duration: the time when someone visits your site and leaves it (or stays inactive for 30 minutes) is one session
- Pages per session: important as it shows potential interest and relevance
- Bounce rate: the percentage of visitors who viewed only one page
- New and returning visitors
Frankly speaking, I do not like it AT ALL. Neither do you? Click Customization (left upper corner), then Dashboards. We are going to create our own reports.
STEP 2: CREATING A DASHBOARD FOR TRAFFIC
To make things more meaningful, I chose my own widgets for analysing statistics.
My first dashboard is for looking at the incoming traffic to know:
– How visitors are finding my website
– What my most popular pages and posts are
– Who my referrals are
1. TO START, LOG INTO GOOGLE ANALYTICS
Click Dashboards (on the top side of the left navigation) > Create. Name your new dashboard. It’s time to see how widgets work.
- Click Add Widget.
- Name your widget How people found you.
- Click the blue outlined box that says Add Metric.
- Type Source in the search box and then click the Source item that appears.
- Now click the green outlined box that says Add dimension.
- Do you see the next column of our How people found you table? Yes, type Users and click the option when it appears below.
- Now click another green box that says Add dimension and type in… yes, New Sessions. Scroll down and save.
Bingo! You have added your first widget. Go on.
2. WIDGET: VISITORS BY MEDIUM
Why: This widget provides a look at the sources of your traffic with a percentage breakdown of the traffic source, i.e., organic, direct, referral, social. You know where your visitors are coming from.
How to create it: Click Add Widget > Pie. Title you report Visitors by Medium. Under Create a pie chart showing: select Users. (Type Users in the search box and then click the Source item that appears.) Under Group by: select Medium.
3. WIDGET: HOW MANY PEOPLE ARE READING YOUR POSTS
Next widgets are mostly self-explanatory. I’ll add only their basic parameters. Use the same scheme with the Add widget command.
Widget type: Metric. Metric: Users.
4. WIDGET: WHICH POSTS ARE THE MOST POPULAR
Widget type: Table. Dimension: Country. Metrics: Users, % Exit.
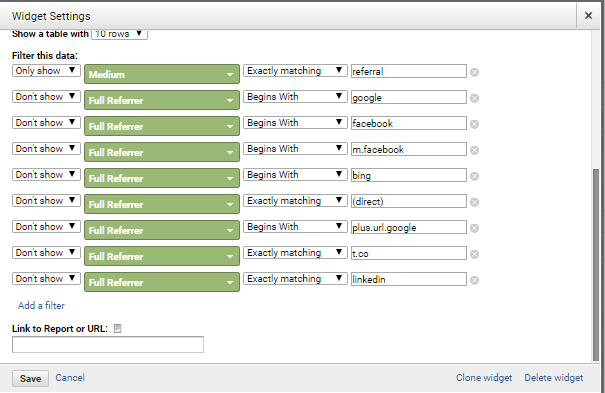
5. WIDGET: REFERRAL WEBSITES
Note that we are excluding major search and social engines, as we’ll have a separate dashboard for them.
Widget type: Table. Dimension: Full Referrer. Metric: Users. And we need a lot of filters here to exclude major websites (see the screenshot below).
6. WIDGET: WHERE DO YOUR READERS LIVE?
Widget type: Table. Dimension: Country. Metrics: Users, Pages/Session.
7. WIDGET: TRAFFIC BY DEVICE
Widget type: Table. Dimension: Device Category. Metrics: Users, Sessions.
8. WIDGET: KEYWORDS
To know how people find you in Google search, if applicable.
Widget type: Table. Dimension: Keywords. Metrics: Pageviews, Pages/Session.
And again a couple of filters here.
Filter this data: Don’t show > Exactly matching > (not set)
Filter this data: Don’t show > Exactly matching > (not provided)
You did it! Your final dashboard should look similar to mine:

STEP 3: CREATING A DASHBOARD FOR CONTENT
Now that you know where you are heading, let’s dive into the content analysis to learn:
– How your content works
– How long visitors are staying
– Where visitors come from
– How many pages they view and where they exit
Create and name your new dashboard.
Note: By default, Google Analytics will display results from the past 30 days. Don’t forget to look at longer periods like 6 to 12 months or even further to determine pages that bring you the majority of search engine traffic, page views, and daily visits by users. Use the filter in the top right corner.
1. WIDGET: PAGEVIEWS BY PAGE TITLE
Widget type: Table. Dimension: Page Title. Metrics: Pageviews, Unique Pageviews.
2. WIDGET: VISITS AND % NEW VISITS BY LANDING PAGE
Note: Landing page here is the first page your visitor sees when entering the website.
Widget type: Table. Dimension: Landing Page. Metrics: Sessions, New Sessions.
3. WIDGET: AVG. TIME ON PAGE AND BOUNCE RATE
Widget type: Table. Dimension: Page Title. Metrics: Avg. Time on Page, Bounce Rate.
4. WIDGET: EXITS AND PAGEVIEWS BY PAGE
Widget type: Table. Dimension: Page. Metrics: Exits, Pageviews.
5. WIDGET: PAGEVIEWS BY COUNTRY / TERRITORY
Widget type: Table. Dimension: Page Title. Metrics: Avg. Time on Page, Bounce Rate.
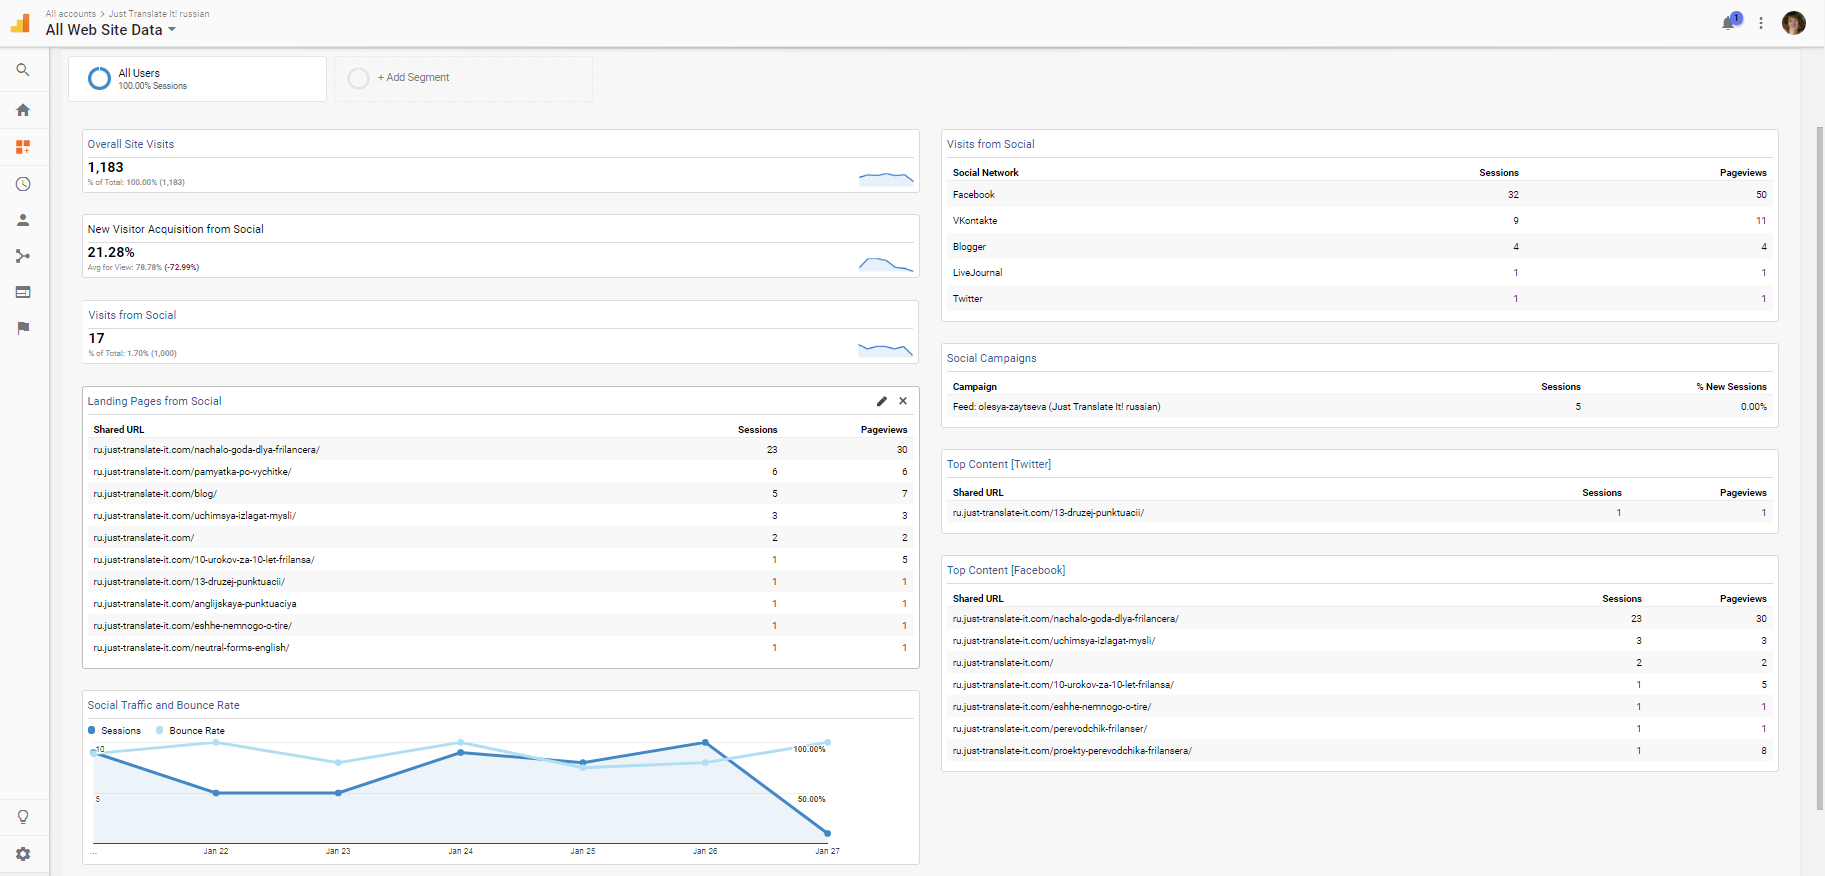
For now, your final dashboard will look like this (you can drag and drop widgets making the layout easier to read):

STEP 4: CREATING A BOARD FOR SOCIAL MEDIA
Social media is an important source of traffic. Use this board to know:
– How many visitors come from social media
– What they prefer to read
– What social networks work best for you
And now comes my favourite trick. You can find a lot of free cute dashboards to import for your own use!
This one was imported from the Buffer blog. I only changed a couple of widgets to make data more meaningful for me. Just click the link provided in the article and add the view to your website for further customisation. The original dashboard includes the following widgets:
1. Real-time visitors to your website from social channels
2. Which social networks send you the most traffic overall
3. Your top landing pages for social traffic
4. How your social traffic fits with traffic from search, direct, and referral
5. Your most shared pages on Twitter and Facebook
6. Your social media campaign results
The widgets I’ve added:
1. WIDGET: OVERALL SITE VISITS
Basic context for the social data: total visits to the site to see if social is a large or small percentage.
Widget type: Metric. Metric: Sessions. Link to reports: Audience / Overview
2. WIDGET: NEW VISITOR ACQUISITION FROM SOCIAL
Are you trying to attract a new audience from social media? Then it’s important.
Widget type: Metric. Metric: % New Sessions. Filter this data: Only show > Social Source Referral > Exactly matching > Yes
3. WIDGET: SOCIAL TRAFFIC AND BOUNCE RATE
The bounce rate in this widget shows the quality of social traffic. Do people read some other posts or take off quickly?
Widget type: Timeline. Graph the following metric over time: Sessions. Compare with (optional): Bounce Rate. Filter this data: Only show > Social Source Referral > Exactly matching > Yes. Link to Report: Acquisition / Social / Network Referrals
STEP 5: CREATING A BOARD FOR PERFORMANCE
An important part of your SEO strategy is to know how your website is running. With this dashboard, you’ll see:
• How quickly your website loads
• Where your visitors are coming from
• If you should act, because something isn’t working as it should
1. WIDGET: AVERAGE PAGE LOAD TIME
Widget type: Metric. Metric: Avg. Page Load Time (sec).
2. WIDGET: AVERAGE SERVER RESPONSE TIME
Widget type: Metric. Metric: Avg. Server Response Time (sec).
3. WIDGET: MOBILE PAGE LOAD TIME (SEC)
Widget type: Metric. Metric: Avg. Page Load Time (sec).
4. WIDGET: AVERAGE PAGE VIEWS PER VISIT
Widget type: Metric. Metric: Pages/Session.
5. WIDGET: AVERAGE TIME ON SITE
Widget type: Metric. Metric: Average Session Duration.
6. WIDGET: LOAD TIME FOR POPULAR PAGES
Widget type: Table. Dimension: Page Title. Metrics: Pageviews, Avg. Page Load Time (sec).
7. WIDGET: SERVER RESPONSE TIME BY COUNTRY
Widget type: Table. Dimension: Country. Metrics: Pageviews, Avg. Server Response Time (sec).
8. WIDGET: VISITS BY DAY SINCE LAST VISIT
Widget type: Table. Dimension: Days Since Last Session. Metric: Sessions.
You will find the Performance dashboard here, ready for further customisation.

Congratulations! Your dashboards are ready.
These are basic configurations. I am planning to use them for three months and then go on with the customisation adding some new metrics and deleting those I do not need. There are plenty of resources to find Google Analytics dashboards and widgets, if you know what data type is meaningful to you.
It may seem overwhelming at first. But the more you use the tool, the easier it becomes. Spend a few minutes a day logged into Google Analytics and get used to the system.
I am planning to cover the best ways to use Google Analytics and our updated dashboards for blogging and self-promotion as I study them to use in my projects. Next comes the newly customised Traffic Dashboard.


Thank you for this post! It is very useful and you provide many information. I tried a few widgets and I will create more in the future. Just in case, if anyone else will have trouble viewing the Google Analytics page in English, even after changing the language, I suggest to replace the language code (“hl=it” > “hl=en” for English) in the page URL (i.e. “https://analytics.google.com/analytics/web/?hl=it&pli=1#dashboard/” becomes “https://analytics.google.com/analytics/web/?hl=en&pli=1#dashboard/”). It will be much easier to use this blog post 🙂 Thank you again, Oleysa!
I totally agree, Enrico! It starts to be much more interesting after you learn widget basics. And thanks for your tip.
I’ve only recently started to use Google Analytics for my website, so this article and tips come at just the right moment! I’ve already put them into practice. Thanks a lot, Olesya 🙂
Glad it was helpful! 🙂