Greater than 5 minutes, my friend!
Google Analytics Made Simple: Know Your Visitors Part 2. Analyzing traffic for bloggers with the Traffic Dashboard
Now that we have our Google Analytics dashboards ready, we’ll go into specific areas of Google Analytics for a more refined approach.
Traffic metrics are the best stats for analyzing how your website and blog are growing. See which channels are working and what needs revision. Evaluate all you marketing channels driving traffic to your website. Ideally, your aim is to come up with new concepts for attracting more targeted visitors.
Check the incoming traffic to know:
– how visitors are finding your website;
– what your most popular pages and posts are;
– who your referrals are.
Our Traffic Dashboard has 8 widgets. We’ll have a look at every widget, slightly improve it and see how to analyze the metrics.
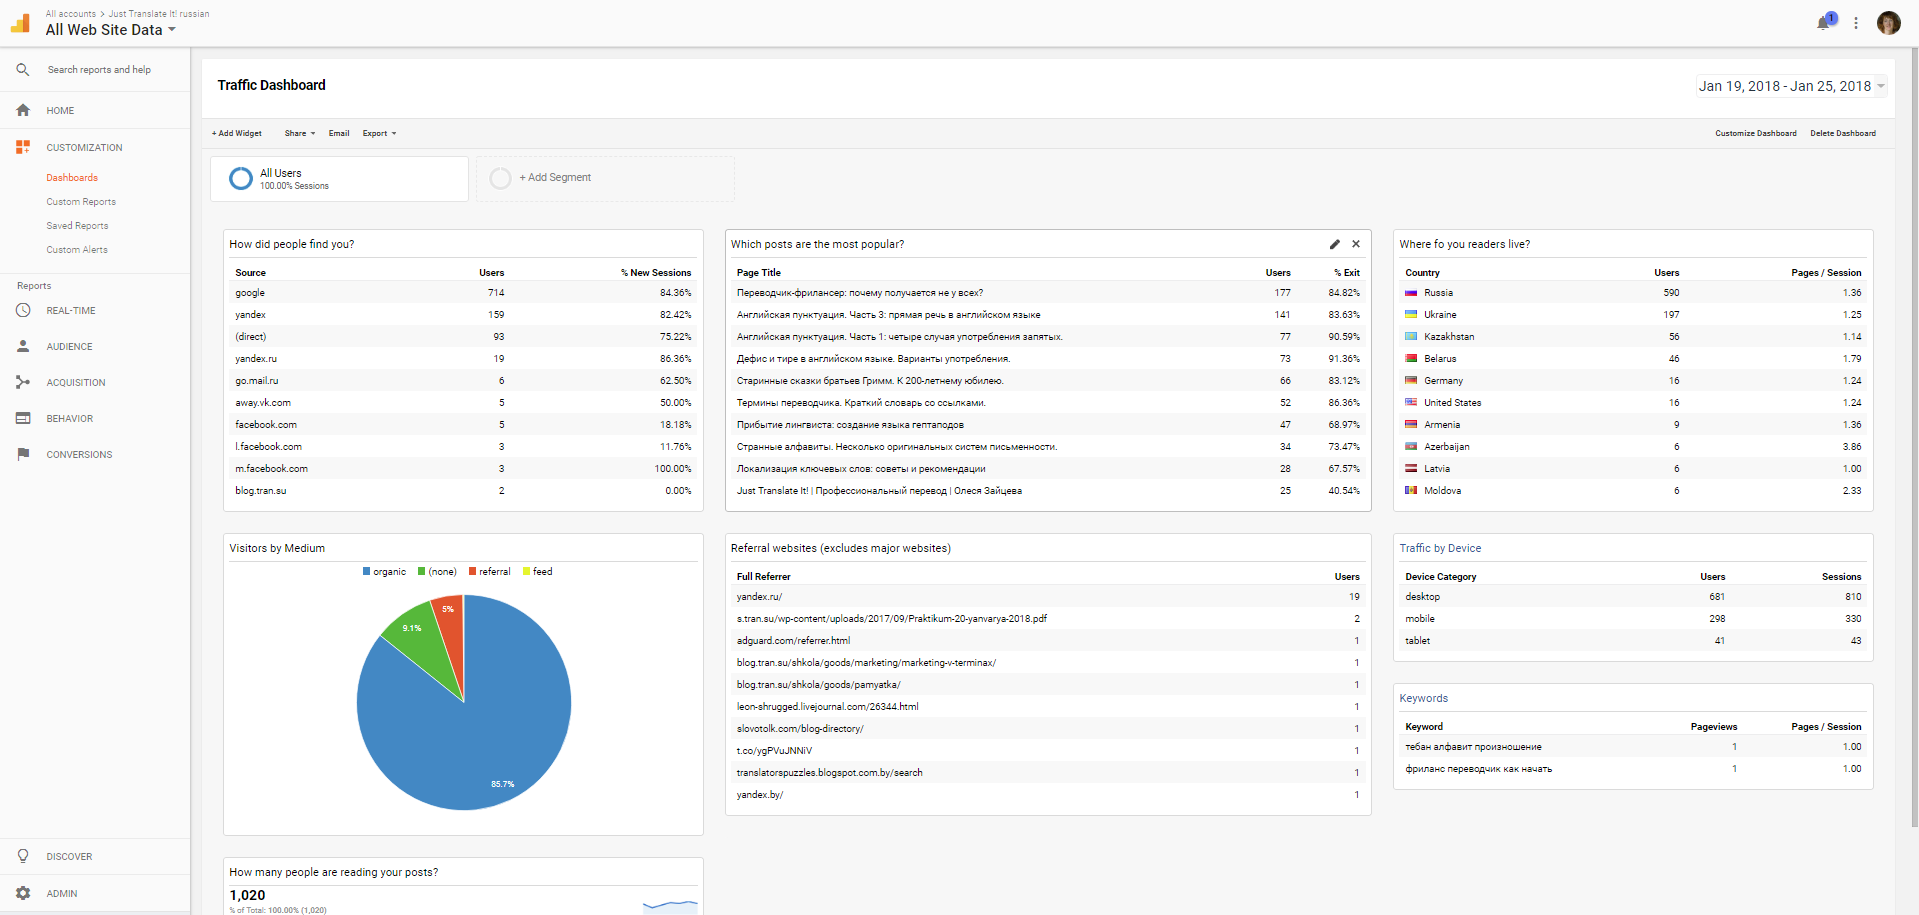
1. How did people find you?
The widget shows us the main sources of our traffic. Here, search engines are likely to be on top positions. Pay attention to the percent of new sessions: which channels are bringing you new visitors and which are for user retention?
The term ‘direct’ refers to the visits during which users took the following actions:
- Typed the domain name directing into the URL bar;
- Clicked on a bookmark;
- Clicked on a link in an email that isn’t tagged using tracking parameters;
- Clicked on a link in a mobile messaging app.
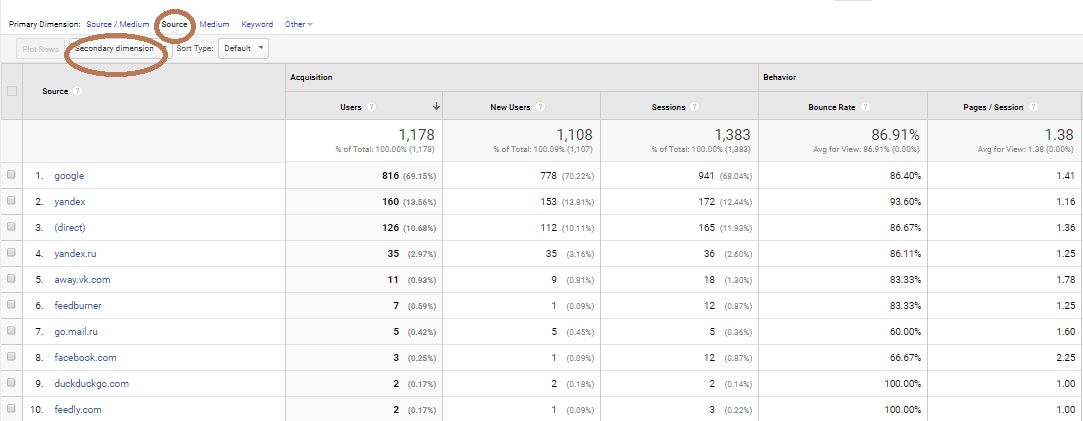
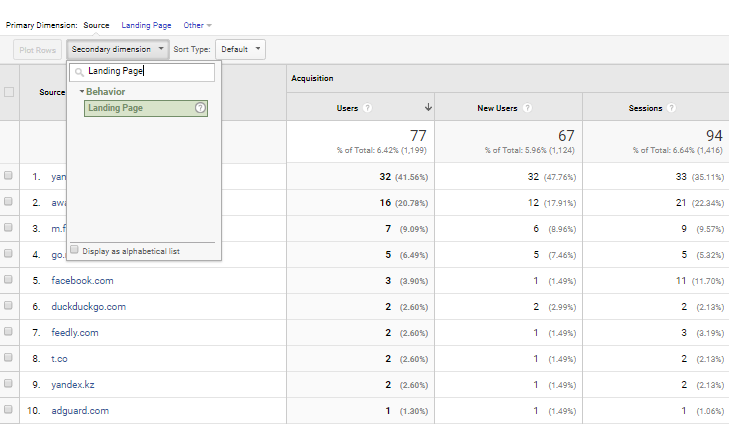
In our default All Traffic report, we see only sources but not the pages they are referring to. Let’s fix that by adding one more dimension.
Go to the Source tab. Click Secondary dimension. Type in Landing Page. Now you see your traffic sources AND the landing pages which attracted visitors. (You can delete your secondary dimension anytime if you no longer need it.)
We can add a direct link to the detailed report making the widget’s headline clickable. Go Acquisition > All Traffic > Source/Medium. Copy the address in the URL field. Open the Widget Settings window and paste in the link in Link to report or URL field. Now we have a clickable widget name in case we need to drill down our data.
2. Visitors by Channel
The chart shows the main channels bringing us traffic. What is the difference between the source and the channel?
Source is the URL where your traffic originated from: a search engine like Google or a domain (example.com). Medium is the format: organic search (organic), cost-per-click paid search (cpc), web referral (referral) or none (direct traffic has a medium of ‘none’). Channel in Google Analytics is a group of traffic sources with the same medium. Organic Search is a channel consisting of Google, Yahoo, Bing, and Aol traffic sources with the same medium called ‘organic’.
Be aware that not all social traffic goes into the Social category. Sometimes you’ll see it in your Referral section.
To add a link to the main report, go Acquisition > All Traffic > Channel. Copy and paste the link. From the same Channel overview page, you can click on the channel of your choice (e.g. Organic Search) and set your Primary Dimension to Landing Page.
3. How many readers read my posts?
Obviously, our aim is to get the figure up every month or so. Note that for each set of metrics you should consider both short-term and long-term values.
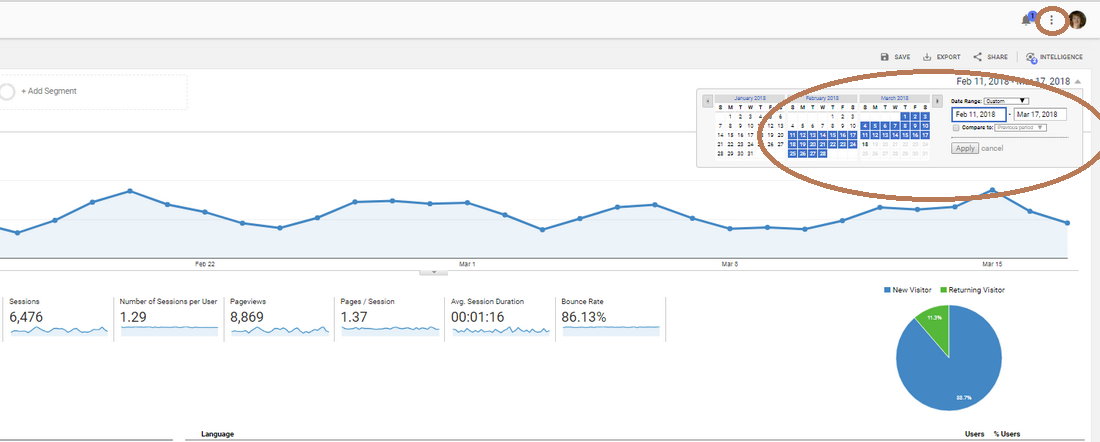
Try at least 30 days to study your most recent publications. To analyze larger trends, extend the graph for 3–6 months.
Beginning from 2016, the default time range for Google Analytics switched to seven days. But the system allows you to set the default date range to the last 7, 14, 28, or 30 days. You can access this setting from the User Settings in the Overflow Menu (three vertical dots).
Go to Audience > Overview and copy the link in the URL field. Now open your widget for editing and add the link.
Try choosing various time periods to look at how much traffic you’re getting. Do you receive more traffic on a particular day of the week? Does it come in the afternoon or in the evening?
4. What posts are the most popular?
Any old post appearing here is your potential gold mine, as it is already ranking high in organic search. If you see that the traffic brought by these pages is important for you, create more content like this.
Spend some time looking for old posts which get page views all the time or at the same time each year. Such posts are called evergreens.
Revisit your evergreen posts regularly to make sure links work, the images aren’t broken, and the info is still accurate. You can even refresh an evergreen post by re-sharing it.
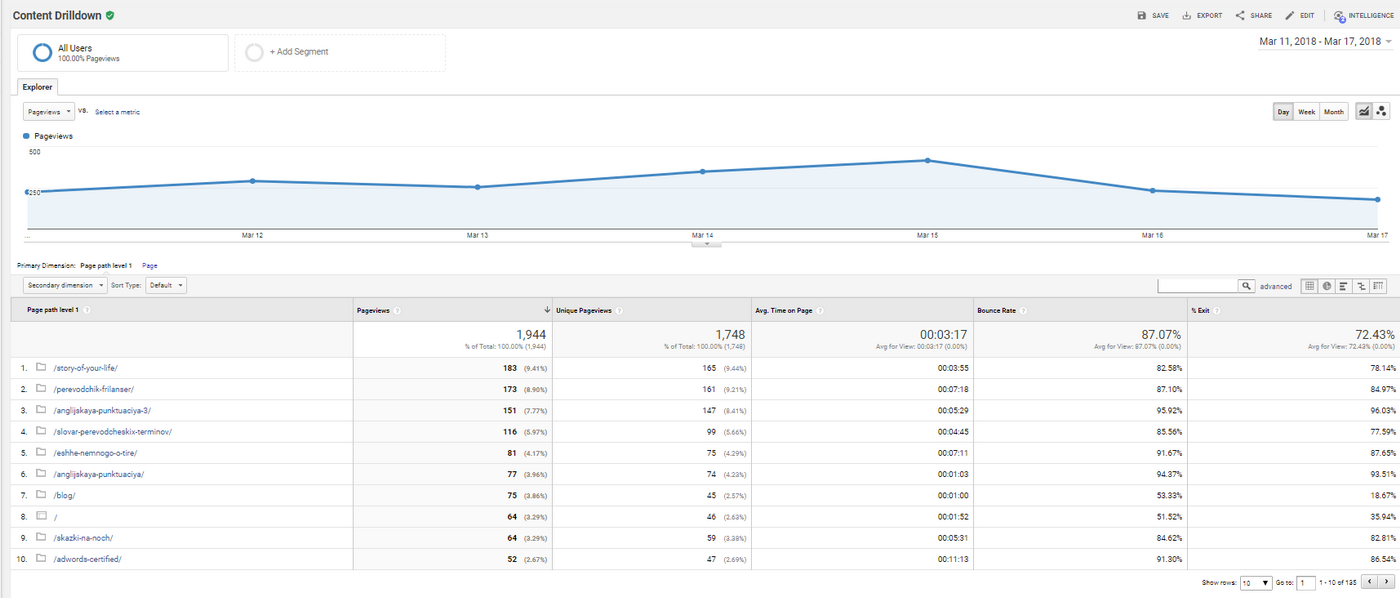
To learn more about user behavior, let’s add and use the report link: Behavior > Site Content > Content Drilldown. Pay attention to the percent of exits. If it is close to 100%, chances are high that the post header and the description are not relevant to the content or do not match user expectations.
5. Referral Websites
Top ten websites bringing us traffic (excluding major search systems and social networks as we have the Social Dashboard for analyzing them).
To see the full list, go to Acquisition > All Traffic > Referrals (and add the link to the dashboard if you wish).
To find out how your links got onto other websites, add one more dimension: click Secondary dimension and type in Landing Page. Check the engagement of this traffic to see how long visitors are staying at the website and how many pages they see.
If you are happy with the results, consider ways to further build traffic from these domains. Let people know you appreciated the reference. You will be far more likely to generate more referrals from the same people in the future.
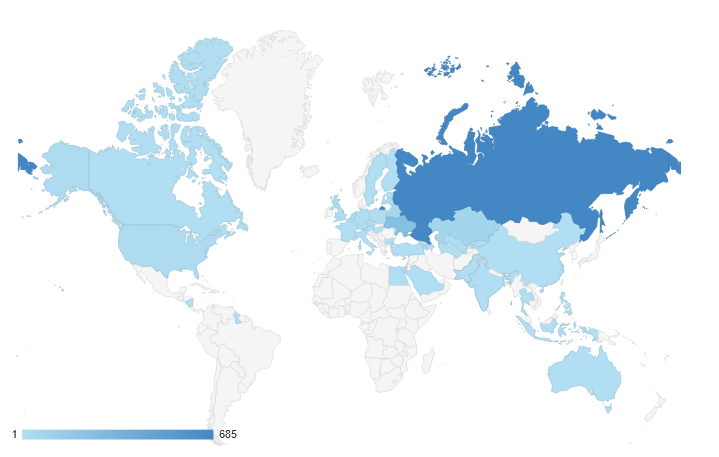
6. Where do your readers live?
Visitors are accessing your website from various countries across the globe. The darker shades represent more traffic and more visitors from specific location.
To add a link to the report: Audience > Geo > Location. Pay attention to dimensions: you can switch to cities, continents and sub continents.
If you publish translated content on your site, you can study geo-trends to see how many visitors are using translated pages compared to the originals.
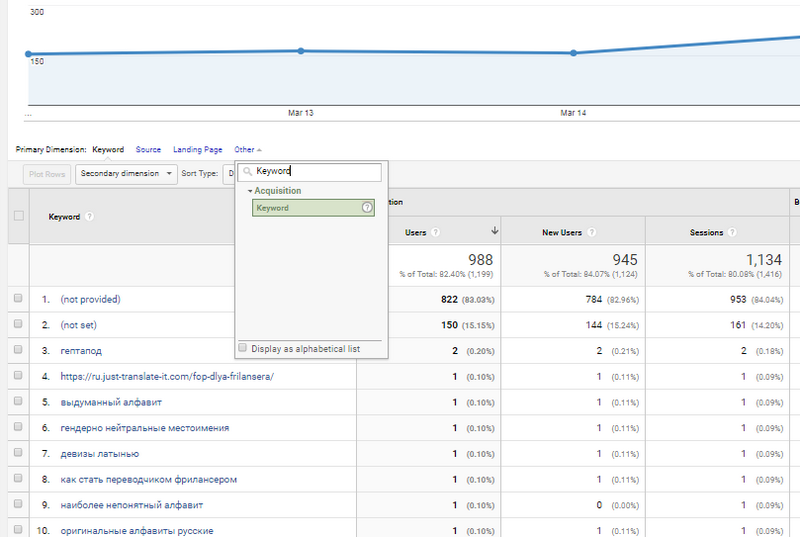
8. Keywords
Most of your visitors are likely to come from search engines. Here you’ll find the (known) keywords that brought them to your website. And what can you do about them?
You can take the keywords you are happy with and provide more niche content targeting at long-tail keywords (phrases consisting of three or more words). Long-tail keywords return fewer results but bring you more targeted traffic. And it is much easier to rank high with them!
To add a link to the report: Acquisition > All Traffic > Channels. Then switch to Primary Dimension > Other > Type and select Keyword.
* * *
See you in April! The Content Analysis Dashboard is the next to come.